


Multiply your advertising profits by 67 in 4 weeks with our AHT method: Case study
Launching an ad on Facebook is simple. Indeed, the company wants to make your life easier by offering solutions to get you started quickly.
However, what is not said is that good results only come after you have optimized your campaign for the weeks and months following its launch.
Why use an optimization process?
When you first launch your Facebook campaign, it will inevitably not be at its full potential.
Sure enough, most people launch their campaign or « boost » their posts, then let the ad run and watch once in a while if all goes well.
The problem with this approach is that you know nothing. Specifically, you have no idea how to improve your campaign. WORST, you don’t even know if you’re wasting your money and if your campaign is going well.
So, if you hope to make significant profits on Facebook, you must have an optimization process to improve your performance based on measurable data. In other words, relying on « the right idea » or your intuition is very likely to cost you significant potential profits or lead you to the false conclusion that Facebook advertising does not work and that it is not profitable.
*If you want to take a look directly at the results of the case study and the tests we performed, you can jump directly to the latter here.
The AHT: a fast and efficient method
The method is based on 4 fundamental principles:
- Analysis: If you want powerful results, you must take advantage of the tools offered to you and avoid going « at random ». Indeed, Facebook offers you the chance to measure the results with its advertising manager. Thus, by using this tool, you will frequently be surprised to discover that what seemed « obvious » to you has misled you.
- The test: To analyze, you must have data. Because of this, you need to test your ideas, try different approaches, target different people, etc.
- Repetition: Once you have collected data, you can now formulate new hypotheses and test them, allowing you to constantly improve and get better results as time goes on.
- Documentation: If you document your tests and their results, nothing is ever lost. You’re building a database of your audience that will be essential to keep improving your campaigns.
The 5 major factors to optimize
The performance of your campaigns depends on 5 major factors which are:
- The offer: A large number of advertisements offer a solution that is poorly suited to their audience. To make sure your offer is relevant, ask yourself if your solution solves a HARD problem for your prospect, one that is painful, urgent, and real. In other words, does your customer know they have a problem, are they currently experiencing that problem, and does your solution end that problem?
- The audience: The best offer in the world in front of the bad audience will not yield any results. Luckily for you, one of Facebook’s strengths is its ability to target your audience very precisely.
- Images: Sometimes just changing an image can bring you 10x more clicks! On the other hand, it is impossible to predict the impact of each image in advance. This is why it is necessary to test several visuals and determine what works best.
- Headline: 50-80% of people will only read your headline. Thus, the more effective your title will be, the more will see all of your advertising and ultimately, the more people will buy your products/services.
- Ad placement: You may have noticed, but when you browse Facebook, this ad giant places ads in over 15 different places, not including its ad partners. Depending on your audience, some placements might be more effective than others. This is why it is highly interesting to test this aspect.
In our experience, over 80% of campaign gains are made on these 5 factors. Quite often, 1 or 2 of these factors will turn out to be more important than all the rest combined. The role of the optimizer is to identify where these potential gains are hidden.
Application – Case Study
Below is a summary of the first 4 weeks of a Facebook lead acquisition campaign.
The purpose of the campaign is to generate sales for a business that sells organic products (we were asked not to reveal the exact sector of the customer in question). The goal is therefore to maximize the number of sales generated while minimizing the cost per purchase.
For this, we used the continuous optimization process. This method involves creating a new version of the ad each week based on past results.
Here is the profitability report for the first 4 weeks:
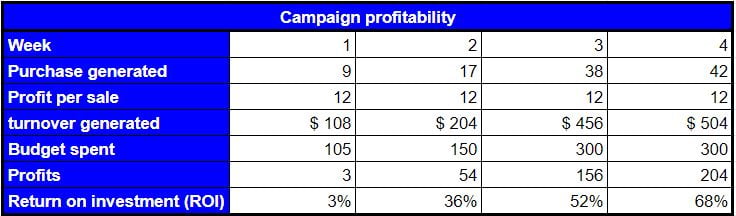
- So we went in 4 weeks from 9 conversions to 42 (+ 366%)
- A cost/purchase of $11.66 to $7.14 (-63%)
- Profits from $3 to $204/week (+6700%)
Detailed statistics
If you are familiar with managing Facebook campaigns, this section will interest you. Otherwise, I advise you to skip this section and go to the next section: Tests Conducted and Results.
Here are the detailed stats over the 4 weeks of the campaign (each version running for a week): Important things to note (for the case study) in this table:
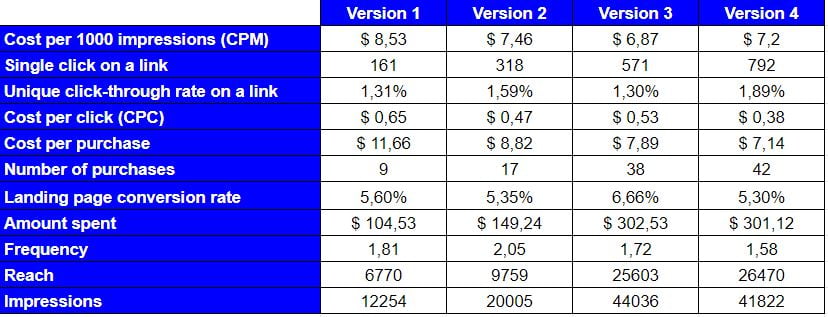
- The different numbers go up and down as you test. This is not necessarily a problem. The goal is to optimize for just two metrics: number of sales and cost per sale. As a result, only these two numbers show improvement with each iteration.
- Interestingly, the increase in conversion rate on the landing page is not due to an improved landing page (as you might expect), but to better targeting campaigns on Facebook (audiences that do not convert are being phased out).
Tests conducted and results
We will now see what actions were taken each week to arrive at this result.
Typically, we test 3-5 hypotheses per week depending on budget and data required to draw relevant conclusions. However, the following lines will focus on the most conclusive tests.
Week 1: Determine the winning placement
When you advertise on Facebook, you have the choice of placing on phones or desktops.
You also have the choice of placing ads in different places on Facebook, Instagram, Messenger and audience networks. Thus, there are more than 18 broadcast locations.
We’ll start by placing our ads in the News Feed on Facebook to give us a starting point. Subsequently, the broadcast locations will be tested over several weeks and will not be detailed in this case study.
We therefore have to test the placement on computer and mobile.
Here are the test results:

Using this data, we notice that:
- Cost per click is 2x higher on desktop
- The conversion rate is almost 4x higher on desktop
- Cost per conversion is 2x lower on desktop
Note that at this stage, we must keep some reserve on these conclusions since there is still little data collected, but the results of the test remain significant.
When we look at the Week 1 campaign profitability summary table, we notice that we only made $3 in profit. However, we must be careful since in this summary there is an already largely profitable desktop campaign and a loss-making mobile campaign.
To make this campaign profitable in the second week, we simply need to eliminate the mobile part.
Attention ! Do not take the results of this test to say « desktop converts better than mobile ».
These results largely depend on the audience, the market and the pages used. The tests must therefore be carried out for each situation, without generalising.
For reference, here is an ad campaign for another client that yielded quite different results:

Week 2: Better define the audience
One of the factors that can have a big impact on your sales is the audience you are targeting. Imagine that you are selling organic beauty products. You may think that the people most likely to buy your product are those with an interest in fashion, but you could be wrong. Perhaps people who have an interest in the environment or health might be more interested in your product. In most cases, interests are paired together to form a single advertisement or ad group. However, doing it this way does not yield any useful information to help us better invest our money.
Thus, we delivered our advertising to the different audiences separately in order to validate our hypotheses.
In addition, we conducted tests to answer the following question: « Which images attract the most clicks? » So we tested 3 different images to see which would be the most relevant for our ads.
We noticed that some images performed significantly better as did some interests.
Long story short, this second week found an image and some interest with results far superior to the rest, which explains most of the improvement seen in week 2.
Week 3: Improving Texts
During this week, we tested the following factors:
- Headlines
- Age
- Income level
The level of income was found to have a very small impact on the results. This is a surprising find for a company that sells « premium » products, which again underlines the importance of testing your preconceptions.
On the other hand, this third week made it possible to find a title that was more effective than the others, which led to an increase in the number of clicks in week 3.
Week 4: Expand audience and eliminate unprofitable audiences
Having collected enough data, we take the opportunity to use Facebook’s feature called « similar audience » allowing us to target people with similar interests to site visitors and buyers.
We also take the opportunity to cut off the audiences that are dragging their feet. It also allows us to monitor how often the same person sees the advertisement.
Thus, the audience reached jumped 59% to reach 28,459 people in week 4.
On the other hand (as expected), it turns out that some of this new audience converts less well, causing the CTR to drop by 0.2% and the CPC to double.
It must be said that it is a necessary evil since if we do not widen the audience, the targeted market will end up being « burnt ». In other words, the audiences chosen initially are smaller, which creates a limit of people to reach.
4 week results:
- Profits increased 67x from $3 to $207/week
- Return on investment (ROI) increased from 3% to 68%
- The campaign went from 9 sales to 42 sales/week
What happens after week 4?
Of course, the story does not end here.
At the end of these tests, we have a campaign that earns us $168 for every $100 invested.
The goal is to broaden target audiences while continuing to optimize results.
Regarding this campaign, you can imagine that it continues to run with a budget and profits that increase over time.
Do the same for your business:
- We can also do this for you. Discover our offers here